Note
Go to the end to download the full example code.
5. Comparative Analysis
import numpy as np
import pandas as pd
import matplotlib.pyplot as plt

from easy_mpl import taylor_plot

from ai4water.utils import edf_plot

from utils import set_rcParams, version_info, SAVE
for lib, ver in version_info().items():
    print(lib, ver)
python 3.9.20 (main, Nov  5 2024, 16:07:55)
[GCC 11.4.0]
os posix
ai4water 1.07
easy_mpl 0.21.4
SeqMetrics 2.0.0
tensorflow 2.10.1
keras.api._v2.keras 2.10.0
numpy 1.21.6
pandas 1.5.3
matplotlib 3.7.1
h5py 3.13.0
sklearn 1.3.1
seaborn 0.13.2
ngboost 0.4.1
shap 0.41.0
plotting empirical distribution function of absolute error between true and predicted values
set_rcParams()
LABELS = {
    'ngb': 'NGBoost',
    'aleoteric': "Bayesian",
    'area': 'Area',
    'cell_count': 'Disinfection Efficiency (%)',
    'train': 'Training',
    'test': 'Test'
}
obs = {}
sim = {
    "train_cell_count": {},
    "test_cell_count": {},
    "train_area": {},
    "test_area": {},
}
_, (ax, ax2) = plt.subplots(1, 2, figsize=(9, 5), sharey="all")
ax.grid(visible=True, ls='--', color='lightgrey')
ax2.grid(visible=True, ls='--', color='lightgrey')

for model in ['ngb', 'aleoteric']:
    for target in ['cell_count', 'area']:
        for mode in ['train', 'test']:

            fpath = f"results/{model}_{target}/{mode}.csv"
            df = pd.read_csv(fpath)
            print(model, target, mode, df.sum())

            obs[f"{mode}_{target}"] = df.iloc[:, 0].values.reshape(-1,)
            sim[f"{mode}_{target}"][model] = df.iloc[:, 1].values.reshape(-1,)

            color = '#005066' if model == 'ngb' else '#B3331D'
            label = f"{LABELS[model]} ({LABELS[mode]})"
            linestyle = '-' if mode == "train" else ':'

            error = np.abs(df.iloc[:, 0] - df.iloc[:, 1])

            if target == "cell_count":
                edf_plot(error, linestyle=linestyle,
                         label=label, color=color,
                          ax=ax, show=False)
            else:
                edf_plot(error, linestyle=linestyle,
                         label=label, color=color,
                          ax=ax2, show=False)
ax.legend(loc=(0.35, 0.05), frameon=False)
ax2.legend(loc=(0.35, 0.05), frameon=False)
ax2.set_xlabel('Absolute Error')
ax2.set_ylabel('')
ax.set_xlabel('Absolute Error')
ax.set_title('Disinfection Efficiency', fontsize=12, weight="bold")
ax2.set_title('Area', fontsize=12, weight="bold")
if SAVE:
    plt.savefig("results/figures/edf", dpi=600, bbox_inches="tight")
plt.tight_layout()
plt.show()

ngb cell_count train TRUE          1.162988e+07
prediction    1.160644e+07
dtype: float64
Support for multi-dimensional indexing (e.g. `obj[:, None]`) is deprecated and will be removed in a future version.  Convert to a numpy array before indexing instead.
linestyle is redundantly defined by the 'linestyle' keyword argument and the fmt string "-" (-> linestyle='-'). The keyword argument will take precedence.
ngb cell_count test TRUE          4.832388e+06
prediction    4.909492e+06
dtype: float64
Support for multi-dimensional indexing (e.g. `obj[:, None]`) is deprecated and will be removed in a future version.  Convert to a numpy array before indexing instead.
linestyle is redundantly defined by the 'linestyle' keyword argument and the fmt string "-" (-> linestyle='-'). The keyword argument will take precedence.
ngb area train TRUE          8595.960000
prediction    8611.138576
dtype: float64
Support for multi-dimensional indexing (e.g. `obj[:, None]`) is deprecated and will be removed in a future version.  Convert to a numpy array before indexing instead.
linestyle is redundantly defined by the 'linestyle' keyword argument and the fmt string "-" (-> linestyle='-'). The keyword argument will take precedence.
ngb area test TRUE          3579.920000
prediction    3543.970292
dtype: float64
Support for multi-dimensional indexing (e.g. `obj[:, None]`) is deprecated and will be removed in a future version.  Convert to a numpy array before indexing instead.
linestyle is redundantly defined by the 'linestyle' keyword argument and the fmt string "-" (-> linestyle='-'). The keyword argument will take precedence.
aleoteric cell_count train TRUE          1.140598e+07
prediction    1.162988e+07
dtype: float64
Support for multi-dimensional indexing (e.g. `obj[:, None]`) is deprecated and will be removed in a future version.  Convert to a numpy array before indexing instead.
linestyle is redundantly defined by the 'linestyle' keyword argument and the fmt string "-" (-> linestyle='-'). The keyword argument will take precedence.
aleoteric cell_count test TRUE          4.832048e+06
prediction    4.832388e+06
dtype: float64
Support for multi-dimensional indexing (e.g. `obj[:, None]`) is deprecated and will be removed in a future version.  Convert to a numpy array before indexing instead.
linestyle is redundantly defined by the 'linestyle' keyword argument and the fmt string "-" (-> linestyle='-'). The keyword argument will take precedence.
aleoteric area train TRUE          8348.824516
prediction    8595.960000
dtype: float64
Support for multi-dimensional indexing (e.g. `obj[:, None]`) is deprecated and will be removed in a future version.  Convert to a numpy array before indexing instead.
linestyle is redundantly defined by the 'linestyle' keyword argument and the fmt string "-" (-> linestyle='-'). The keyword argument will take precedence.
aleoteric area test TRUE          3478.42111
prediction    3579.92000
dtype: float64
Support for multi-dimensional indexing (e.g. `obj[:, None]`) is deprecated and will be removed in a future version.  Convert to a numpy array before indexing instead.
linestyle is redundantly defined by the 'linestyle' keyword argument and the fmt string "-" (-> linestyle='-'). The keyword argument will take precedence.
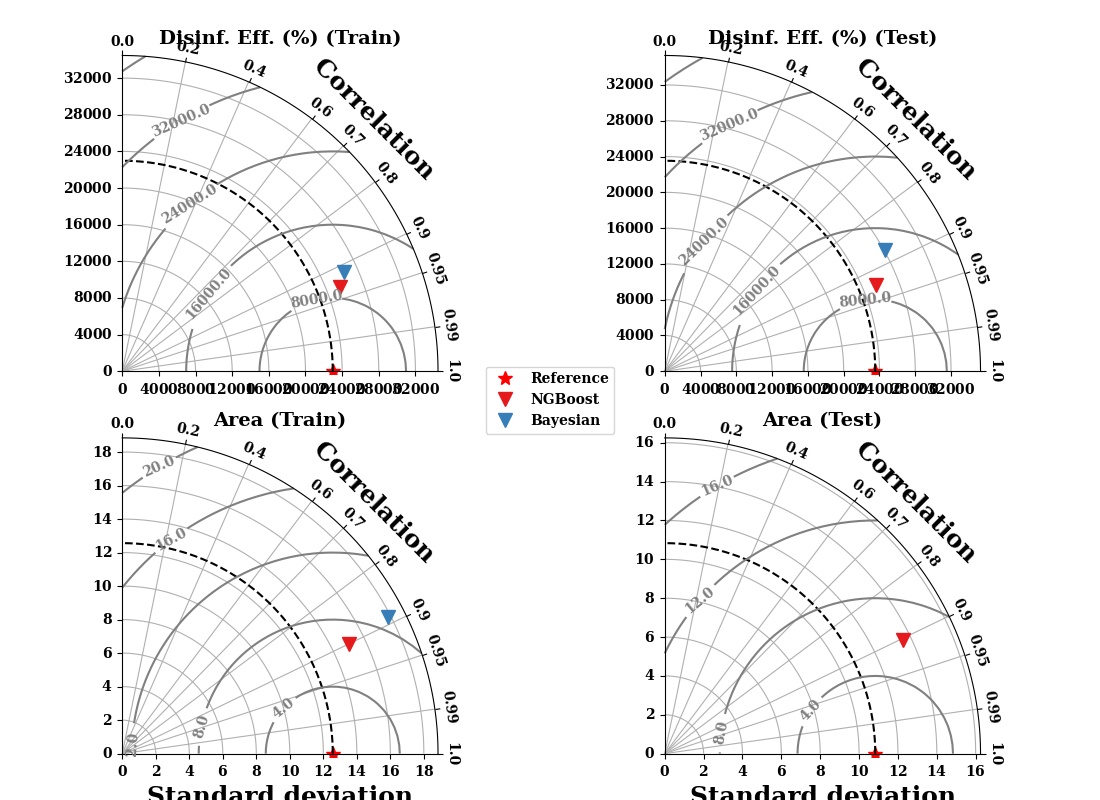
figure = taylor_plot(
    observations=obs,
    simulations=sim,
    plot_bias=True,
    show=False,
    figsize =(11, 8),
)
figure.axes[0].axis['left'].label.set_text('')
figure.axes[1].axis['left'].label.set_text('')
figure.axes[0].set_title('Disinf. Eff. (%) (Train)', fontsize=14, weight="bold")
figure.axes[1].set_title('Disinf. Eff. (%) (Test)', fontsize=14, weight="bold")
figure.axes[2].set_title('Area (Train)', fontsize=14, weight="bold")
figure.axes[3].set_title('Area (Test)', fontsize=14, weight="bold")

figure.legends[0].get_texts()[1].set_text('NGBoost')
figure.legends[0].get_texts()[2].set_text('Bayesian')

figure.axes[0].ticklabel_format(axis='x', style='sci', scilimits=(0,0))

if SAVE:
    plt.savefig("results/figures/taylor", dpi=600, bbox_inches="tight")
plt.tight_layout()
plt.show()
Total running time of the script: (0 minutes 1.521 seconds)